Late Inning Rallies to Win games in the American League 2003-2019 with weights
- a fan
- Feb 9, 2020
- 4 min read
Updated: Feb 24, 2020
This is the same scenario as this but with weights applied to each number to account for their percent within the total population of occurences within the sample.
Our Criteria here: Win - a given team wins the game if they were losing/tied (in this order) in extra innings, 9th, 8th or 7th inning. Loss - a given team loses the game when they were winning/tied in extra innings, 9th, 8th, or 8th inning.
ZScore: is based on the population standard deviation and mean here. It tells you how many standard deviations from the mean you are. For wins, a positive ZScore is what you want as that relfects "you came back to win more than others". So 1.5 is better than 0.5. For the loss, a negative ZScore is what you want as that reflects "you did not lose your leads like others around the mean". So -1.5 is better than -0.5
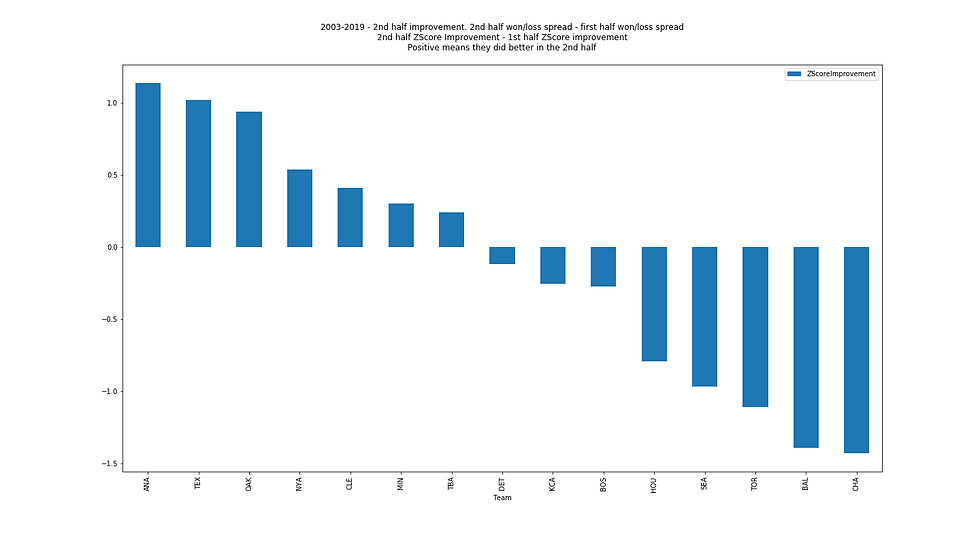
"Which team in the AL had the BEST improvement between the first half of the season and the second half of the season between 2003 and 2019 with late inning rallies and late inning losses.
From July to the end of regular season:
2nd half inn Rally wins: Anaheim Angels: 1.14
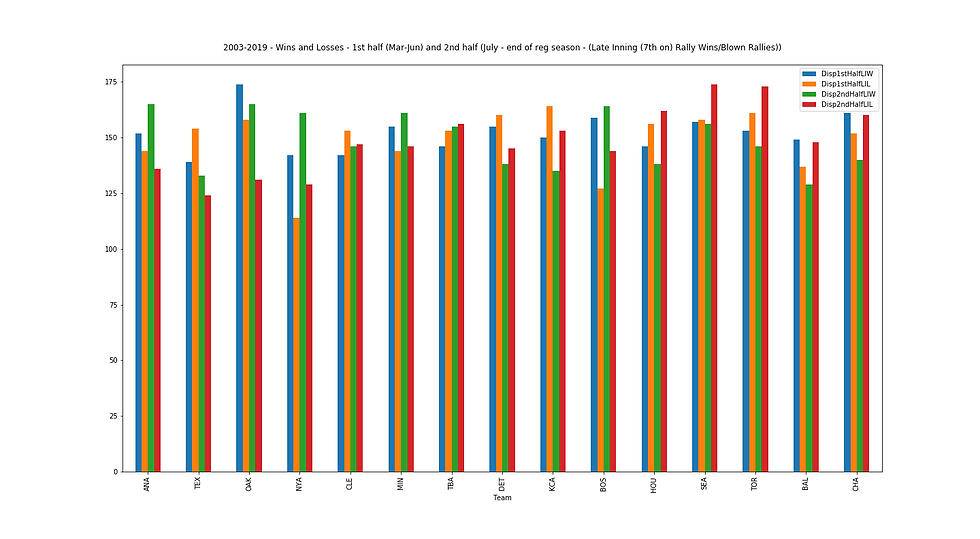
If you look at the data below, you'll see Texas is influenced by the fact that they lost a lot less in the late innings in the 2nd half.
If you want to see the significance again of the ZScore and what it can be telling you, please see:
https://baseballfan999.wixsite.com/baseballdat/post/what-does-the-zscore-tell-you Note: We did take the league change where the Houston switched leagues after 2012 so their figures from 2013 on were not included. We also treat Montreal as WSH.


The figures based on this time frame 2003-2019
Green: Most improved "devil magic" AL team in the 2nd half in this study
Second Half ZScore improvement over First Half:
    Team  ZScoreImprovement
25  SLN           2.315956
9   COL           1.979303
18  NYN           1.420010
0   ANA           1.136570
14  MIA           1.024799
27  TEX           1.018952
19  OAK           0.940428
17  NYA           0.540984
20  PHI           0.453258
8   CLE           0.411754
29  WAS           0.383953
16  MIN           0.304716
7   CIN           0.273005
26  TBA           0.243325
21  PIT          -0.053742
6   CHN          -0.076383
10  DET          -0.114353
12  KCA          -0.252776
4   BOS          -0.273139
15  MIL          -0.675979
13  LAN          -0.719267
11  HOU          -0.792323
24  SFN          -0.805687
23  SEA          -0.966879
1   ARI          -1.070192
28  TOR          -1.104966
2   ATL          -1.317827
3   BAL          -1.389925
22  SDN          -1.406904
5   CHA          -1.426672


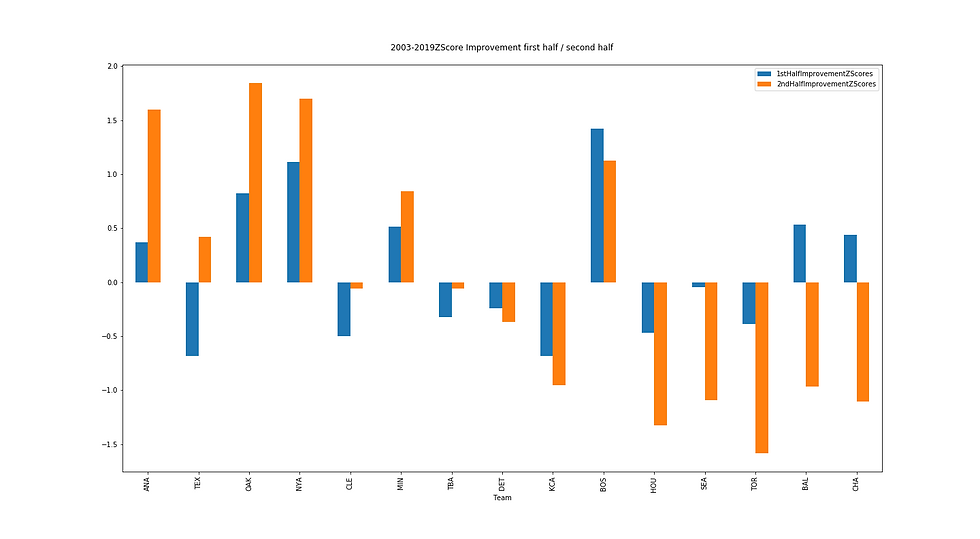
   Team  ZScoreImprovement  2ndHalfImprovement  1stHalfImprovement
25  SLN           2.315956            2.273758           -0.825264
9   COL           1.979303            0.133391           -2.817947
18  NYN           1.420010           -0.294682           -2.479019
0   ANA           1.136570            1.902572            0.509576
14  MIA           1.024799           -0.684394           -2.341295
27  TEX           1.018952            0.504141           -0.945771
19  OAK           0.940428            2.193548            1.143103
17  NYA           0.540984            2.022668            1.542501
20  PHI           0.453258            0.360724           -0.265117
8   CLE           0.411754           -0.063862           -0.698300
29  WAS           0.383953           -0.486704           -1.149989
16  MIN           0.304716            1.003705            0.707768
7   CIN           0.273005            0.356364            0.000000
26  TBA           0.243325           -0.067786           -0.450398
21  PIT          -0.053742           -0.063426            0.000000
6   CHN          -0.076383           -1.272886           -1.377233
10  DET          -0.114353           -0.431779           -0.338928
12  KCA          -0.252776           -1.129904           -0.945987
4   BOS          -0.273139            1.342633            1.969443
15  MIL          -0.675979           -0.976460           -0.132559
13  LAN          -0.719267            1.296207            2.584033
11  HOU          -0.792323           -1.569311           -0.649882
24  SFN          -0.805687            0.741064            2.065849
23  SEA          -0.966879           -1.294682           -0.067786
1   ARI          -1.070192           -1.621622           -0.294383
28  TOR          -1.104966           -1.877289           -0.540564
2   ATL          -1.317827            0.800349            2.902733
3   BAL          -1.389925           -1.147123            0.738541
22  SDN          -1.406904           -0.555144            1.454702
5   CHA          -1.426672           -1.307759            0.606198


   Team  Disp1stHalfLIW  Disp1stHalfLIL  Disp2ndHalfLIW  Disp2ndHalfLIL
25  SLN             141             154             179             147
9   COL             123             168             154             152
18  NYN             142             178             167             171
0   ANA             152             144             165             136
14  MIA             143             177             152             162
27  TEX             139             154             133             124
19  OAK             174             158             165             131
17  NYA             142             114             161             129
20  PHI             152             156             168             163
8   CLE             142             153             146             147
29  WAS             159             175             156             163
16  MIN             155             144             161             146
7   CIN             162             162             166             161
26  TBA             146             153             155             156
21  PIT             157             157             145             146
6   CHN             150             170             136             156
10  DET             155             160             138             145
12  KCA             150             164             135             153
4   BOS             159             127             164             144
15  MIL             153             155             153             167
13  LAN             177             139             166             147
11  HOU             146             156             138             162
24  SFN             175             145             175             165
23  SEA             157             158             156             174
1   ARI             169             173             143             167
28  TOR             153             161             146             173
2   ATL             185             144             159             147
3   BAL             149             137             129             148
22  SDN             179             159             137             146
5   CHA             161             152             140             160

Weighted..
   Team  1stHalfLIW  1stHalfLIL  2ndHalfLIW  2ndHalfLIL
25  SLN    4.278244    5.103508    6.983653    4.709895
9   COL    3.255649    6.073596    5.169137    5.035745
18  NYN    4.339144    6.818162    6.078684    6.373365
0   ANA    4.971810    4.462234    5.933958    4.031386
14  MIA    4.400473    6.741769    5.035745    5.720139
27  TEX    4.157736    5.103508    3.855493    3.351351
19  OAK    6.515171    5.372068    5.933958    3.740410
17  NYA    4.339144    2.796643    5.649738    3.627071
20  PHI    4.971810    5.236927    6.151700    5.790976
8   CLE    4.339144    5.037444    4.646033    4.709895
29  WAS    5.440284    6.590273    5.304272    5.790976
16  MIN    5.170002    4.462234    5.649738    4.646033
7   CIN    5.647515    5.647515    6.006103    5.649738
26  TBA    4.587045    5.037444    5.236486    5.304272
21  PIT    5.304282    5.304282    4.582607    4.646033
6   CHN    4.841833    6.219066    4.031386    5.304272
10  DET    5.170002    5.508930    4.150828    4.582607
12  KCA    4.841833    5.787820    3.972319    5.102223
4   BOS    5.440284    3.470841    5.862249    4.519616
15  MIL    5.037444    5.170002    5.102223    6.078684
13  LAN    6.741769    4.157736    6.006103    4.709895
11  HOU    4.587045    5.236927    4.150828    5.720139
24  SFN    6.590273    4.524424    6.675022    5.933958
23  SEA    5.304282    5.372068    5.304272    6.598954
1   ARI    6.146116    6.440499    4.457062    6.078684
28  TOR    5.037444    5.578007    4.646033    6.523322
2   ATL    7.364967    4.462234    5.510244    4.709895
3   BAL    4.777491    4.038950    3.627071    4.774194
22  SDN    6.894986    5.440284    4.090889    4.646033
5   CHA    5.578007    4.971810    4.272014    5.579773
The data file can be found here


Comments