
Late Inning Rallies to Win games in the American League West 2013-2019 with weights
- a fan
- Feb 9, 2020
- 2 min read
Updated: Feb 24, 2020
This is the same scenario as this but with weights applied to each number to account for their percent within the total population of occurences within the sample.
Our Criteria here: Win - a given team wins the game if they were losing/tied (in this order) in extra innings, 9th, 8th or 7th inning. Loss - a given team loses the game when they were winning/tied in extra innings, 9th, 8th, or 8th inning.
ZScore: is based on the population standard deviation and mean here. It tells you how many standard deviations from the mean you are. For wins, a positive ZScore is what you want as that relfects "you came back to win more than others". So 1.5 is better than 0.5. For the loss, a negative ZScore is what you want as that reflects "you did not lose your leads like others around the mean". So -1.5 is better than -0.5
"Which team in the AL West had the BEST improvement between the first half of the season and the second half of the season between 2013 and 2019 with late inning rallies and late inning losses.
From July to the end of regular season:
2nd half inn Rally wins: Texas Rangers Zscore 1.15


The figures based on this time frame (2013-2019)
Green: Most improved "devil magic" AL team in the 2nd half of the season in this division
Second Half ZScore improvement over First Half:
Team ZScoreImprovement
27 TEX 1.154073
23 SEA 0.710469
0 ANA 0.497628
19 OAK -0.157995
11 HOU -1.574315
Team ZScoreImprovement 2ndHalfImprovement 1stHalfImprovement
27 TEX 1.154073 0.726837 -0.497923
23 SEA 0.710469 -0.072950 -0.816719
0 ANA 0.497628 0.599042 0.066978
19 OAK -0.157995 0.370075 0.531672
11 HOU -1.574315 -1.363152 0.319315
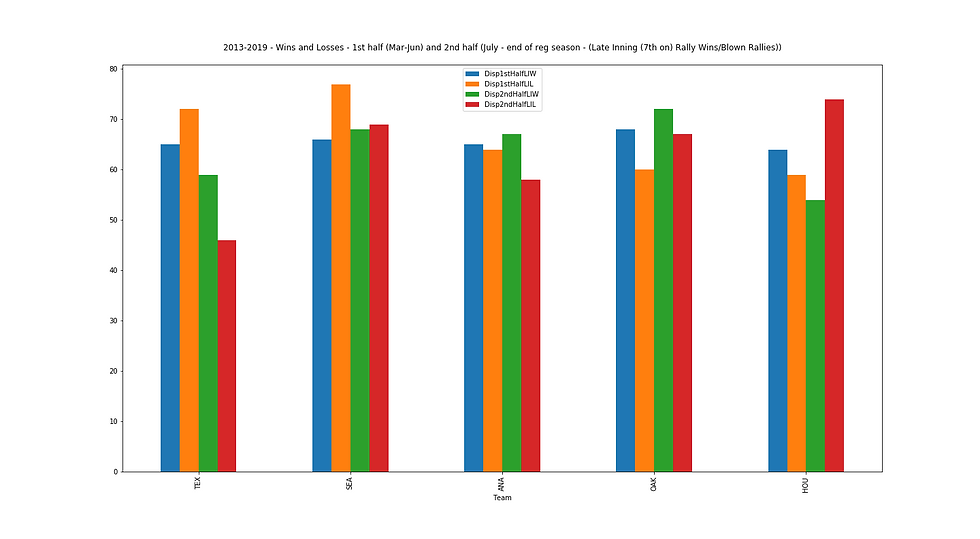
Team Disp1stHalfLIW Disp1stHalfLIL Disp2ndHalfLIW Disp2ndHalfLIL
27 TEX 65 72 59 46
23 SEA 66 77 68 69
0 ANA 65 64 67 58
19 OAK 68 60 72 67
11 HOU 64 59 54 74
Weighted..
Team 1stHalfLIW 1stHalfLIL 2ndHalfLIW 2ndHalfLIL
27 TEX 2.193666 2.691589 1.853568 1.126731
23 SEA 2.261682 3.078401 2.462194 2.535144
0 ANA 2.193666 2.126687 2.390309 1.791267
19 OAK 2.400831 1.869159 2.760383 2.390309
11 HOU 2.126687 1.807373 1.552716 2.915868
Team 1stHalfW 1stHalfL 2ndHalfW 2ndHalfL
27 TEX 299 271 265 300
23 SEA 285 289 270 290
0 ANA 284 288 283 279
19 OAK 297 277 293 267
11 HOU 316 260 286 272The data file can be found here

Comments